CA Standard 9.0: Students demonstrate and explain the effect that changing a coefficient has on the graph of quadratic functions; that is, students can determine how the graph of a parabola changes as a, b, and c vary in the equation y = a(x-b)2+ c.
CA Standard 10.0: Students graph quadratic functions and determine the maxima and minima of the function.
The most basic quadratic is y = x2. When you graph straight lines, you only needed two points to graph your line, though you generally plot three or more points just to be on the safe side. However, three points will almost certainly not be enough points for graphing a quadratic, at least not until you are very experienced.
The term quadratic comes from the word quadrate meaning square or rectangular. Similarly, one of the definitions of the term quadratic is a square. In an algebraic sense, the definition of something quadratic involves the square and no higher power of an unknown quantity; second degree. So, for our purposes, we will be working with quadratic equations which means that the highest degree we'll be encountering is a square. Normally, we see the standard quadratic equation written as the sum of three terms set equal to zero. Simply, the three terms include one that has an x2, one has an x, and one term is "by itself" with no x2 or x.
Students will complete engagement and exploration activities that will allow them to get motivated and acquainted with the subject matter.
1. Watch 90 second video on graphing a quadratic function. Click the video to play..
2. Students break into groups of 3 and build a table of values for a parent function y = x2. It must include negative and positive values of x.
3. Each group will assign different roles (in rotation) of who would investigate the function using online manipulatives (SeeingMath, Graph Sketcher, Quadratic Function Explorer, Desmos) to generate graphs.
4. Students will then share and discuss their generated visual output among their classmates. Ask them to compare and contrast to previous knowledge of linear function's graphs and table of values.
CA Standard 10.0: Students graph quadratic functions and determine the maxima and minima of the function.
Objectives:
- Find and interpret the maximum and minimum values of a quadratic function.
- Understand patterns, functional representations, relationships and functions.
- Analyze and create multiple representations of mathematical situations and structures using algebraic symbols.
- Specify and describe locations and spatial relationships using coordinate geometry and other representational systems.
Introduction:
The general technique for graphing quadratics is the same as for graphing linear equations. However, since quadratics graph as curvy lines called "parabolas", rather than the straight lines generated by linear equations, there are some additional considerations.The most basic quadratic is y = x2. When you graph straight lines, you only needed two points to graph your line, though you generally plot three or more points just to be on the safe side. However, three points will almost certainly not be enough points for graphing a quadratic, at least not until you are very experienced.
The term quadratic comes from the word quadrate meaning square or rectangular. Similarly, one of the definitions of the term quadratic is a square. In an algebraic sense, the definition of something quadratic involves the square and no higher power of an unknown quantity; second degree. So, for our purposes, we will be working with quadratic equations which means that the highest degree we'll be encountering is a square. Normally, we see the standard quadratic equation written as the sum of three terms set equal to zero. Simply, the three terms include one that has an x2, one has an x, and one term is "by itself" with no x2 or x.
A quadratic function is described by an equation of the form: f(x)=ax2 + bx + c,
ax2 = quadratic term
bx = linear term
c =constant term
a ≠ 0
Note: If a = 0, the x2 term would disappear and we would have a linear equation. If the highest degree in an equation is 1, meaning that the x-term is x1 or in the form
Students will be engaged in both formal and informal approach as they are introduced to the topic of 2nd degree polynomial functions or quadratic. I will provide brief background knowledge by engaging the students in exploration activities that allow them to make connections and arrive at an understanding of quadratic functions. To enhance and sustain engagement, students will be immersed in various modalities such as multimedia, online manipulatives and group activities to achieve the learning goals objective.
ax2 = quadratic term
bx = linear term
c =constant term
a ≠ 0
Note: If a = 0, the x2 term would disappear and we would have a linear equation. If the highest degree in an equation is 1, meaning that the x-term is x1 or in the form
Students will be engaged in both formal and informal approach as they are introduced to the topic of 2nd degree polynomial functions or quadratic. I will provide brief background knowledge by engaging the students in exploration activities that allow them to make connections and arrive at an understanding of quadratic functions. To enhance and sustain engagement, students will be immersed in various modalities such as multimedia, online manipulatives and group activities to achieve the learning goals objective.
Priming/Review (15-20 minutes)
Students will complete engagement and exploration activities that will allow them to get motivated and acquainted with the subject matter.
1. Watch 90 second video on graphing a quadratic function. Click the video to play..
| image from www.google.com |
3. Each group will assign different roles (in rotation) of who would investigate the function using online manipulatives (SeeingMath, Graph Sketcher, Quadratic Function Explorer, Desmos) to generate graphs.
4. Students will then share and discuss their generated visual output among their classmates. Ask them to compare and contrast to previous knowledge of linear function's graphs and table of values.
Guided Learning
- Students will watch video on Voicethread and then individually read/do activity on Interactive Mathematics
- From the previous activity on SeeingMath, leave the default function as y = x2 , student click on New command button and plot a quadratic functions f(x) = x2 - 4x + 6 by plugging the numeric coefficients, or they can use Quadratic Explorer (use slider to change the values of the coefficients in a given function).
Group Activity/Assessment
- Working in group of 2s, generate 5 of your own quadratic function f(x) and then plot them using either SeeingMath or Quadratic Explorer.
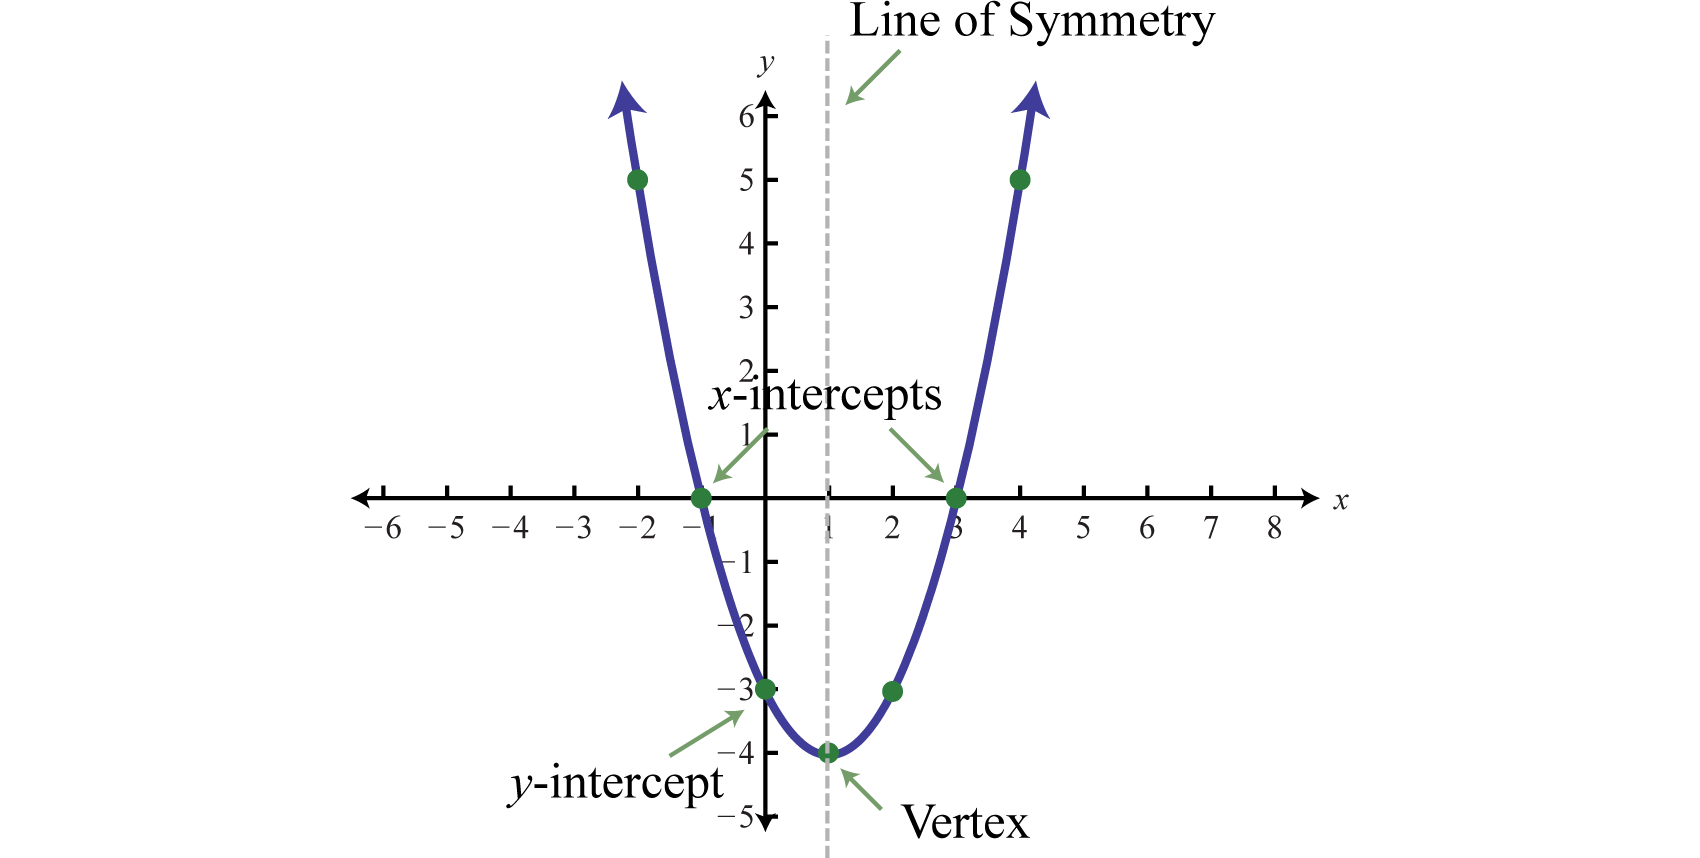
- Describe the behavior of the transformed equations by creating two-column notes with critical attributes of the quadratic functions such as vertex, intercepts, and line of symmetry.
- What happens to the graph display when they change different parts of the equations?
- Explain what condition(s) will make a quadratic a linear function, or what’s the effect of making the coefficient of x2 less than 0, equal to 0, or greater than 0?
- What causes the parabola to open upward or downward and what are the names of each openings?How do we know if the function has x-intercepts or y-intercepts?
Homework
Summarize your ideas of the different characteristics in a quadratic equation and how to find then in a graph and in the equation. Must be submitted in PowerPoint slides
Closing/Recap (3 minutes video)
